Top Network Monitoring Tools for Enterprise WAN Environments
Explore the best network monitoring tools for enterprise WANs. ✓ Learn how to improve uptime, visibility, & performance with Lightyear's guide!

A reliable network keeps your business connected. For enterprise Wide Area Networks (WANs) that span offices and providers, the right network monitoring tools safeguard performance, security, and uptime. This guide explains why monitoring matters, what features to look for in modern network monitoring utilities, and which network monitoring programs deliver the most value for enterprise WANs.
Why Network Monitoring Matters for Enterprise WANs
Enterprise WANs connect distributed teams, data centers, and cloud environments. When network visibility is limited, diagnosing network issues across routers, firewalls, or service providers becomes challenging. Reliable network monitoring software gives IT teams real-time insights, automated notifications, and detailed metrics to optimize performance, strengthen connectivity, and reduce downtime.
The challenge of maintaining uptime
Maintaining uptime across multiple sites requires monitoring every network device and circuit—from MPLS and SD-WAN links to VPN tunnels. Without comprehensive network monitoring tools, identifying the root cause of outages—whether misconfigured routing, a failed switch, or an overloaded firewall—can take hours. Real-time dashboards, topology maps, and automated workflows help IT teams isolate disruptions quickly, keeping users productive and operations stable.
How WAN visibility impacts performance, security, and cost
Network visibility drives both performance and operational efficiency:
- Performance: Detect bottlenecks, bandwidth saturation, or latency before they affect user experience. Real-time visualization of network traffic and flow data helps network administrators maintain consistent network health.
- Security: Spot unusual traffic patterns or unauthorized access attempts early to prevent breaches and other security threats.
- Cost: Optimize bandwidth utilization, verify provider SLAs, and remove underused links to control pricing and ensure scalability.
With full observability, enterprises can manage hybrid environments efficiently—spanning on-premises, SaaS, and IoT systems—and maintain reliable uptime across their entire IT infrastructure.
From reactive troubleshooting to proactive monitoring
Modern IT management can’t wait for outages to reveal performance issues. Automated, real-time monitoring capabilities detect anomalies before they impact end-user experience. Configurable thresholds for CPU utilization, SNMP polling, and bandwidth usage enable proactive remediation. This approach minimizes disruptions, improves network performance, and streamlines troubleshooting across distributed infrastructures.
What to Look for in a Network Monitoring Tool
Choosing the right network monitoring solution depends on scalability, automation, and integration. The most effective tools combine ease of use with advanced infrastructure monitoring and analytics, giving IT teams a comprehensive view of network performance and uptime across on-premises, cloud, and SaaS environments.
End-to-end visibility across hybrid and multi-cloud environments
A complete monitoring solution should deliver end-to-end visibility across hybrid environments, multi-cloud systems, and IoT networks. The best network monitoring tools automatically perform network discovery and map connectivity between routers, firewalls, and endpoints. Using SNMP, NetFlow, and auto-discovery polling, they provide topology maps, dashboards, and network maps that simplify troubleshooting and improve observability. This integrated view allows IT teams to correlate traffic analysis, bandwidth utilization, and application performance across both Microsoft and Linux systems.
Real-time analytics and automated alerts
Real-time analytics, automated alerts, and configurable thresholds are crucial for preventing downtime. Modern monitoring software uses APIs, plugins, and synthetic monitoring to collect telemetry and trigger notifications when metrics exceed defined limits. Dashboards with intelligent visualization highlight root causes, making it easier to remediate performance issues before they disrupt connectivity. This automation ensures scalable, proactive workflows that keep infrastructure running smoothly.
Integration and extensibility
Enterprise IT infrastructure relies on a mix of monitoring, security, and application performance tools. Scalable network monitoring software should integrate seamlessly with APM, SIEM, and ITSM systems through APIs and plugins. Tools like SolarWinds, ManageEngine, Paessler PRTG, Nagios, Cisco, and Datadog exemplify strong interoperability and comprehensive network monitoring capabilities. These integrations create unified visibility and enable automated performance management across distributed infrastructures.
Scalability for large networks
Large WANs include thousands of network devices and connections. The ideal platform is scalable, automated, and capable of handling high volumes of flow data without losing functionality. Leading providers—such as SolarWinds, PRTG by Paessler, ManageEngine OpManager, and Nagios—offer deployment flexibility for both on-premises and cloud environments, combining powerful visualization with robust infrastructure monitoring.
Reporting and SLA tracking
Comprehensive reporting converts network metrics into actionable insights. Look for tools that offer customizable dashboards, SLA compliance tracking, and historical correlation to validate provider performance and pricing accuracy. Real-time analytics and traffic analysis reports help network administrators optimize bandwidth, identify bottlenecks, and align IT management strategies with long-term business goals.
Top Network Monitoring Tools for Enterprise WANs
The market for network monitoring software offers scalable options for every enterprise architecture. These leading network monitoring tools combine real-time visibility, automated workflows, and flexible deployment for hybrid environments, helping IT teams maintain uptime and optimize network health.
1. SolarWinds Network Performance Monitor
SolarWinds Network Performance Monitor (NPM) provides comprehensive network visibility and deep functionality for large, distributed infrastructures. It uses SNMP, NetFlow, and auto-discovery polling to collect metrics on bandwidth, latency, and application performance across routers, firewalls, and endpoints. Real-time dashboards and topology maps visualize network traffic, detect bottlenecks, and validate service-provider SLAs.
Best for: Enterprises that need scalable infrastructure monitoring, automated alerts, and strong visualization to remediate performance issues quickly.
2. Cisco ThousandEyes
Cisco ThousandEyes delivers end-to-end observability across WAN, internet, and SaaS connectivity. Its synthetic monitoring agents measure latency, jitter, and packet loss across ISPs and cloud providers, giving IT teams a detailed correlation between network health and digital experience.
Best for: Multi-cloud and hybrid environments that require granular traffic analysis, routing validation, and visibility into third-party performance metrics.
3. Paessler PRTG Network Monitor
Paessler PRTG offers ease of use with comprehensive network discovery and flexible sensor-based monitoring. It supports SNMP, WMI, SSH, and flow data collection, providing customizable dashboards, network maps, and automated notifications. The solution integrates easily with Microsoft, Linux, and IoT devices, delivering strong functionality and scalability for complex environments.
Best for: IT teams seeking an all-in-one, cost-efficient monitoring solution with intuitive visualization and built-in workflows.
4. ManageEngine OpManager
ManageEngine OpManager monitors routers, firewalls, and servers in real time using SNMP, flow protocols, and plugin-based automation. It includes bandwidth analysis, VoIP performance monitoring, and configuration management that support both on-premises and cloud deployments.
Best for: Medium-to-large enterprises needing a balance of pricing flexibility, performance metrics, and ease of use within a unified IT management platform.
5. LogicMonitor
LogicMonitor is a SaaS-based infrastructure monitoring platform offering automated discovery, AIOps-driven anomaly detection, and predictive analytics. It provides real-time visualization across cloud environments and on-premises systems without requiring agents, giving IT management end-to-end observability into network traffic, bandwidth utilization, and application performance.
Best for: Enterprises wanting a scalable, cloud-native monitoring solution with strong integration capabilities and hybrid-environment support.
6. Nagios XI
Nagios XI brings open-source flexibility to enterprise network management. It offers extensive plugin support, customizable dashboards, and automated alerts for Linux, Windows, and virtual systems. Its correlation features and topology maps make it easy to pinpoint the root cause of performance issues and maintain consistent uptime.
Best for: Organizations that value control, open-source extensibility, and comprehensive network monitoring across distributed infrastructure.
How to Evaluate the Right Tool
Selecting the right network monitoring solution requires aligning technical functionality with business priorities. The best tools combine scalable automation, strong observability, and ease of use while supporting hybrid environments and complex IT infrastructures.
Align monitoring with business priorities
Start by defining what matters most—avoiding downtime, optimizing user experience, or improving network performance management. If uptime and SLA tracking are top priorities, look for monitoring tools with real-time analytics, automated workflows, and customizable dashboards. If your goals include optimizing bandwidth utilization or troubleshooting recurring network issues, prioritize platforms that provide in-depth traffic analysis, correlation reports, and application performance insights.
Monitoring software from SolarWinds, Cisco, ManageEngine, Paessler PRTG, and Datadog exemplifies this approach by combining end-to-end visibility with comprehensive network monitoring capabilities. Each integrates with APIs, plugins, and AIOps-driven automation to streamline incident response, improve connectivity, and validate service provider SLAs.
Assess scalability, automation, and integration
Enterprises need scalable monitoring capabilities that support on-premises, SaaS, and multi-cloud deployments. The ideal solution provides automated discovery, flexible polling intervals, and synthetic monitoring for continuous performance visibility. Open-source and commercial options alike should include SNMP and NetFlow support to track metrics across routers, firewalls, and endpoints.
Integrations with ITSM and APM platforms—like ServiceNow, Jira, or Microsoft ecosystems—enable better data correlation and seamless workflows for IT teams. With strong API connectivity and plugin ecosystems, these monitoring tools bring infrastructure monitoring, troubleshooting, and root cause detection together under one unified dashboard.
Compare pricing and licensing models
Network monitoring tools vary widely in pricing models. Some offer perpetual licenses, while others use subscription-based or sensor-tiered structures. Evaluate total cost of ownership, including deployment, training, and ongoing maintenance. For cost transparency, tools like SolarWinds, PRTG, and ManageEngine provide clear pricing tiers that scale as your network grows.
Prioritize vendor reliability and support
When evaluating vendors, prioritize reliability, update frequency, and community support. Open-source options like Nagios offer flexibility and control, while SaaS-based tools like Datadog or LogicMonitor deliver rapid scalability and ease of deployment. Check for documented SLAs, responsive support teams, and integrations that simplify IT management. Reliable vendors help network administrators resolve performance issues faster, ensure uptime, and reduce disruptions across complex environments.
How Lightyear Simplifies Network Performance Management
Even the most advanced network monitoring tools can’t simplify vendor relationships, pricing management, or procurement workflows on their own. Lightyear complements enterprise monitoring software by automating provider management, improving network visibility, and connecting technical performance metrics with business outcomes.
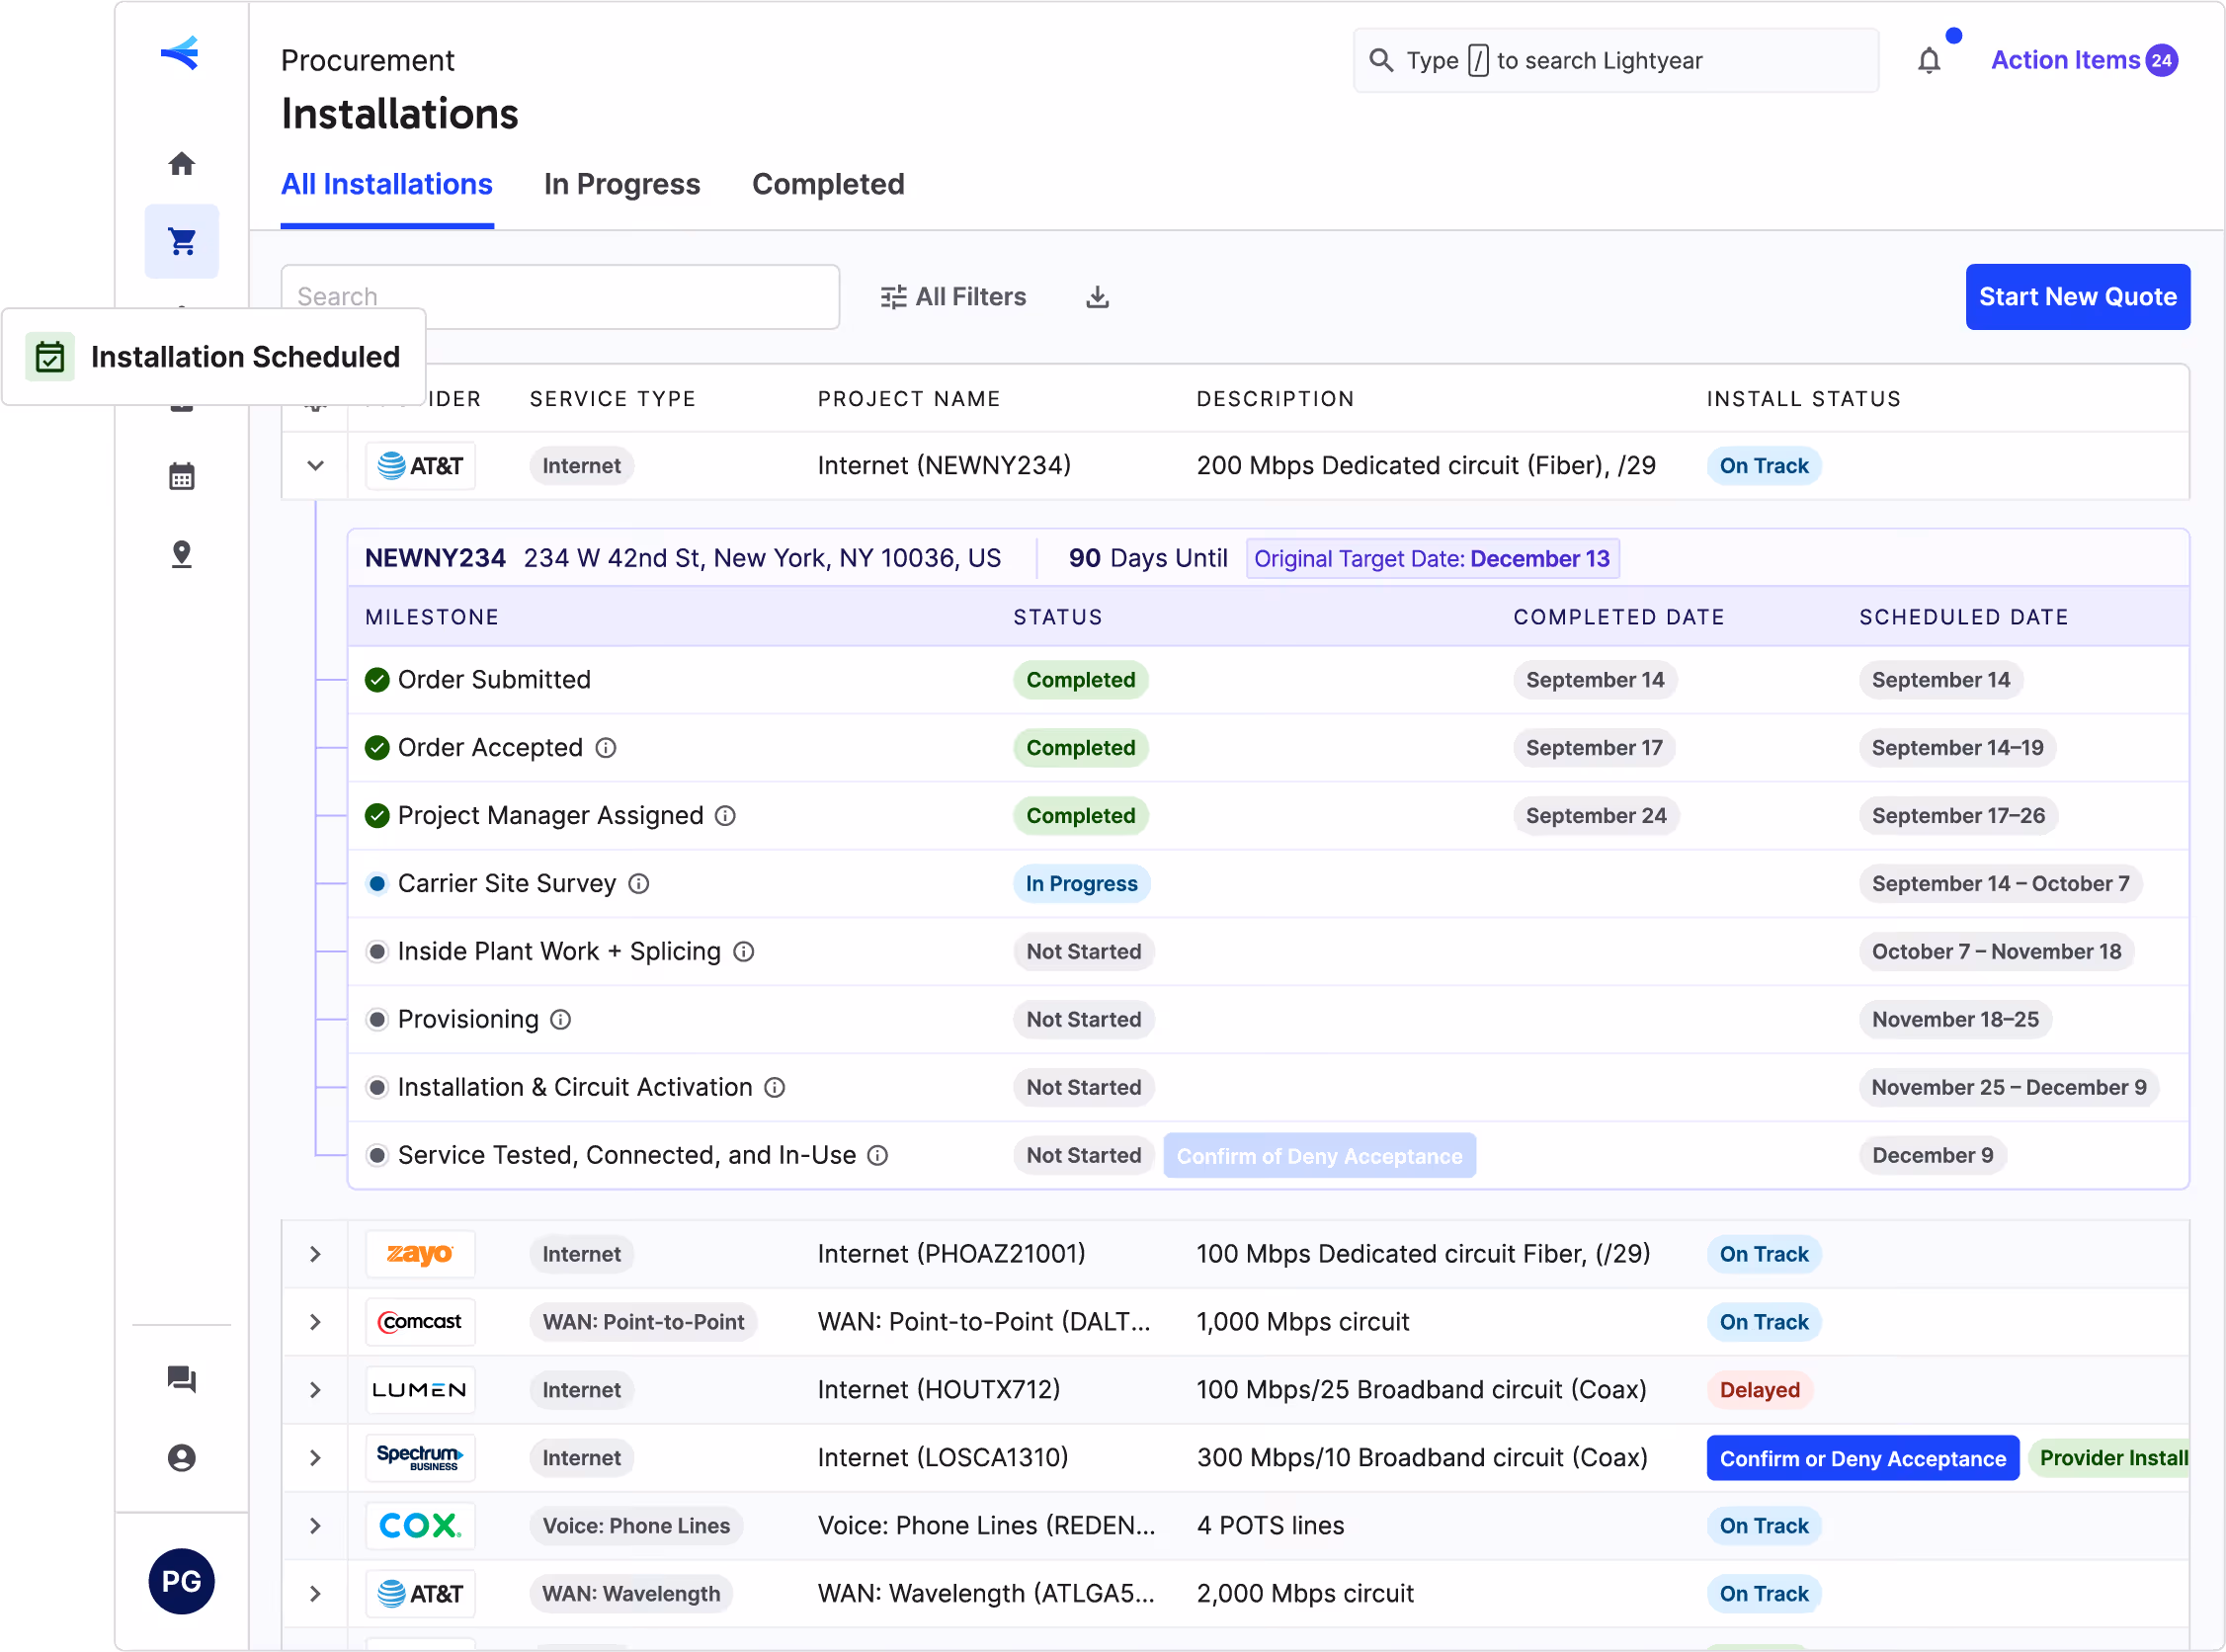
Centralized visibility
Lightyear consolidates data from multiple service providers into a single, unified monitoring solution. It centralizes contracts, renewal dates, and circuit information alongside live metrics from your existing network monitoring software—such as SolarWinds, PRTG, ManageEngine, or Datadog. By integrating via API, Lightyear enables IT teams to correlate bandwidth utilization, latency, and packet loss data with provider SLAs and pricing.
Customizable dashboards and visualization tools make it easy to analyze performance trends across routers, firewalls, and endpoints, improving observability and troubleshooting efficiency. This comprehensive network monitoring approach allows IT management to sustain uptime, optimize resources, and maintain accountability across distributed and hybrid environments.
Automated workflows and analytics
Lightyear automates the link between technical monitoring capabilities and business insights. Through seamless API integrations, it pulls telemetry from multiple platforms, correlates network traffic and application performance metrics, and visualizes them within unified dashboards. Automated workflows help identify root causes, remediate performance issues, and flag bottlenecks that affect connectivity or user experience.
With plugins that support both on-premises and cloud environments, Lightyear offers scalable, infrastructure monitoring functionality. These features enable IT teams to minimize disruptions, maintain network health, and optimize bandwidth across complex network infrastructures without manual intervention.
ROI-driven network operations
By connecting monitoring data with procurement and network management, Lightyear helps enterprises improve uptime, reduce downtime, and accelerate change management. This API-driven framework aligns performance monitoring with provider accountability—empowering IT administrators to validate SLAs, control pricing, and negotiate better contracts based on real-time evidence.
The result is a smarter, automated, and scalable approach to comprehensive network monitoring. Lightyear enables organizations to unify performance data, application insights, and provider intelligence into one ecosystem—transforming observability into measurable ROI.
Building a Reliable, Visible WAN
Modern enterprise WAN performance depends on real-time observability, automation, and alignment between tools, workflows, and operations. Scalable network monitoring tools help IT teams detect anomalies, analyze network traffic, and maintain uptime across on-premises, SaaS, and multi-cloud environments.
Strong network monitoring software supports continuous infrastructure monitoring, correlating metrics such as bandwidth utilization, latency, packet loss, and CPU performance across routers, firewalls, and endpoints. These insights allow IT management to troubleshoot network issues, identify bottlenecks, and optimize connectivity to enhance user experience and digital reliability.
When paired with Lightyear’s platform, this data transforms into actionable business intelligence. Through API integrations, automated reporting, and intuitive dashboards, Lightyear links performance monitoring, provider accountability, and pricing visibility into a unified, comprehensive network monitoring ecosystem.
By connecting network performance data with financial and operational insights, enterprises gain more than visibility—they gain control. Lightyear helps organizations remediate disruptions faster, optimize bandwidth allocation, and maintain consistent uptime. The result is a secure, data-driven approach to network management that improves observability, performance, and ROI across the entire IT infrastructure.
FAQs about Network Monitoring Tools
1. What are network monitoring tools?
Network monitoring tools are software systems that provide real-time visibility into network performance. They collect telemetry through SNMP, NetFlow, and API integrations to track metrics such as latency, bandwidth, and packet loss across routers, firewalls, and other network devices. These tools help IT teams identify bottlenecks, detect performance issues, and prevent downtime by delivering automated notifications and intuitive dashboards.
2. What is the best network monitoring tool for enterprises?
The best network monitoring solution depends on infrastructure size, monitoring capabilities, and pricing requirements. SolarWinds, Paessler PRTG, ManageEngine, Cisco ThousandEyes, Datadog, and Nagios all provide scalable, automated functionality for hybrid environments. Each integrates seamlessly with APIs and plugins for visualization, correlation, and performance monitoring across on-premises, SaaS, and cloud environments.
3. How do network monitoring tools improve performance?
These tools optimize network performance by analyzing traffic patterns, monitoring application performance, and correlating telemetry from endpoints and data centers. Real-time dashboards and topology maps help IT management troubleshoot network issues, remediate disruptions, and maintain uptime. By tracking key metrics and automating workflows, network administrators can ensure network health, connectivity, and ease of use across complex infrastructures.
4. What is the difference between open-source and enterprise monitoring software?
Open-source monitoring software, such as Nagios or Zabbix, offers flexibility and control for IT teams familiar with scripting and custom workflows. Enterprise-grade tools like SolarWinds, ManageEngine, and Datadog provide automated polling, AIOps-driven observability, and out-of-the-box dashboards for comprehensive network monitoring. Both approaches support SNMP, flow data, and infrastructure monitoring; the choice depends on scalability, support, and total cost of ownership.
5. How does Lightyear integrate with monitoring tools?
Lightyear connects directly to leading network monitoring software via API to pull real-time metrics, performance data, and SLA results from providers. It integrates with SolarWinds, ManageEngine, and PRTG to visualize and correlate network performance, bandwidth utilization, and latency alongside financial and operational insights. This unified view strengthens network management, streamlines troubleshooting, and improves uptime across your entire IT infrastructure.
Let us show you the product and discuss specifics on how it might be helpful.
Schedule a Demo


Revolutionize Your Telecom Experience
Learn how you can get one step closer to optimal business efficiency for all your telecom services.